There is one resource that always plays a role in modern businesses, a key element that often remains elusive and hard to come by. Information, the missing puzzle piece for many businesses, comes at a very high price today.
What a better way to gain that valuable data than through an interest graph - a modern mix between the power of search engines and social media. Read on to see what exactly interest graphs are and how to create on for your business.
What is an interest graph
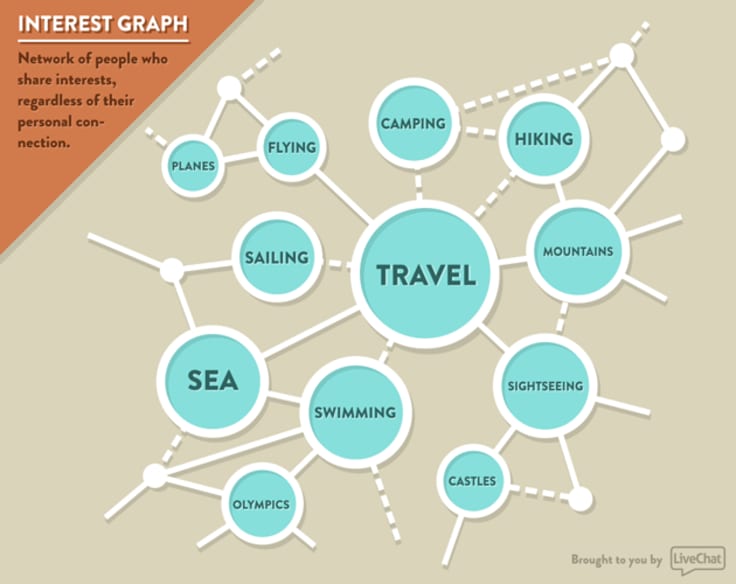
Interest graph is a way to determine the general direction in which you should be going. It incorporates your customers' interests and connections: it is a representation of individual's interests. Think of it as a map that shows what your customers are interested in and makes a connections between those interests. https://www.youtube.com/watch?v=Cmjm2XDIdwc?rel=0 Gravity is one of the services that fully grasps the concept of an interest graph.
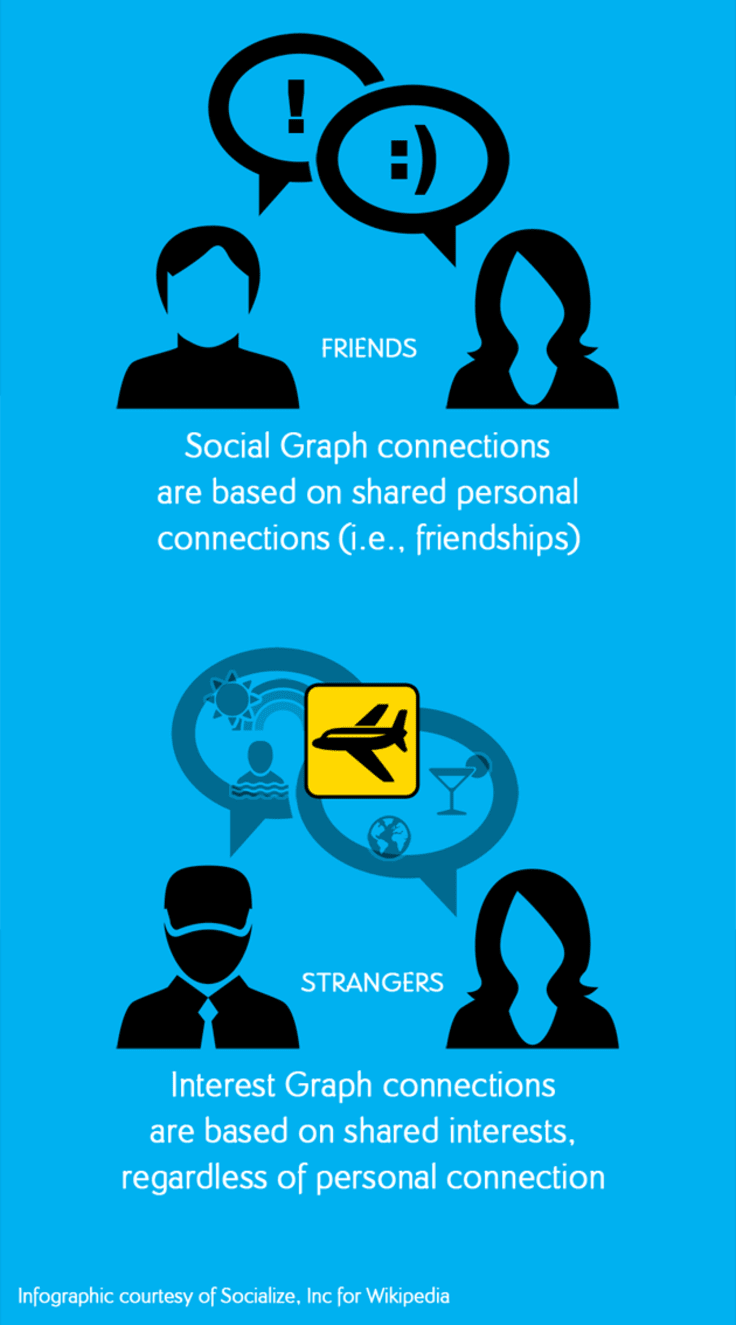
Interest graphs are different than social graphs. They don't take into account what your friends "liked" or "shared". Instead, they use the interest data you provide in the form of your "likes", things you follow, products you buy etc.
To put it simply, by creating an interest graph, you can discover previously untapped possibilities and focus on a particular path your business can take. Interest graph will allow you to create a business that will address specific needs of a targeted group of consumers. This is an invaluable source of information. Based on this data, you could prepare your business offering to address those specific needs.
Why should I create an interest graph?
Even though it's natural to befriend people with common interests, the social circles we belong to are much more diverse than that. The social graph, recommending what we like to our friends and vice versa is not the only way of learning about what can be marketed with success. The other way marketeers can utilize the social media information stream is through interest graphs.
We shouldn't think of interest graphs as replacements of social graphs - they are simply better for different things. Online retailers have to remember that the relation between a potential customer and his friends doesn't always decide on the type of product or offering he will get. Sometimes, people won't choose anything their friends got simply because they don't share the same interests. This is where the interest graph comes in. It shows the possible interests of a model client regardless of his or her social background. Based on these interests, marketeers can prepare an offering that simply couldn't go unnoticed for such client.

Despite the fact that the social graph model is going strong and its data is in high demand today, marketeers of the future may look for more optimized interest graph data. Soon, we might spot less "your friends like this" indicators and more "you might be interested in" signs when we browse the web looking for a new movie or a new book to read.
In short, the interest graph can be considered an alternative for the social graph. If your business has or will have a recommendation tools of some sorts, it may be more wise to use the interest graph model in order to produce much more accurate results than those observable while using a social graph model.
Making an interest graph for your business
There are few steps you should go through when making an interest graph for your company:
1. Collecting Data
In order to create an interest graph for your company, you would need to start collecting data first. There are two ways of collecting data: explicit and implicit. You can have customers answering various questions, or filling in their profiles, however, they might hide some crucial data out of fear of targeted ads. The covert approach to data collection can make use of client's purchase history.
Both ways have their pros and cons. The first, may give you more information about not yet explored avenues, however, your visitors may hide some crucial data. The second approach may generate more accurate data but on a narrower number of topics. Depending on your business, both takes can generate valuable results and you should use the one that works best with your system.
2. Determining data importance
The data you collect may vary greatly when it comes to importance to your interest graph. Some sources prove to be more valuable than others, e.g. a simple "Like" on one a product is worth much less than a repeatable check-in in a particular venue.
Interest graph data importance and relevancy can be closely tied to the amount of effort it takes to generate that data. The more time-consuming and engaging a particular activity is, the more accurate the data becomes.

Different data types should be represented on the graph adequately. "Likes" or "Shares" should be less valuable and be further away from a user on the graph than check-ins or even written reviews or places/products. By giving the variables a certain value, you will be able to create closer and farther groups of interests.
3. Looking for patterns
After gathering and analyzing the data, you ought to look for various patterns that will appear. The researched portion of your customers' interest should be divided by interest groups - visitors with similar interest will create groups that will connect with other groups on some common ground.
You should look for the relations various user groups have with interests and how interests connect with other interests. For example, you could have a group of sport fans among your customers that would be interested in basketball, football etc. All the sports that they are interested in could have a common related interest of "sport apparel". Having that knowledge would allow you tie two remote concepts and show possible, not yet explored, connections.
Visualization of your interest graph is a great way to discover various relations and interactions between user groups and interests.
You have to choose the elements that your customers focus around. Bring them to the front of your business and focus on them. When thinking about your marketing strategy or product development you should have the data from the interest graph in mind.
4. Using the interest graph
After your interest graph is completed, you can use it for a number of marketing activities. Ranging from targeted ads to e-mail campaigns, there are a lot of areas that can benefit from the newly gathered data:
- Specials and discounts: create specials and discounts on popular products to garner even larger attention and customer base
- Targeted advertisement: you can launch advertisement targeted at a particular customer group which can greatly increase its success rate when compared to the general advertising
- Product development: interest graph data can be useful when it comes to developing new features or offerings for your customers; you will know precisely what your customers may want to purchase and what they need
- E-mail campaigns: you can turn wide and general e-mail campaigns on smaller, more precise ones, increasing conversion rate
Considering the scale of the social media boom, interest graphs are becoming more and more dependable source of information that shows the correct way of development for many companies. Use its power wisely and you are sure to be awarded with an influx of new customers and higher conversion rates.
Photo courtesy of Team Traveller and stevendepolo.