Customer Service Report
Self-service, conversational AI, and automation are reshaping how companies interact with
customers. This report gives you a clear view of where your business stands — and where it can
go.
In this report:
1. Introduction and methodology
2. Metrics covered in the report along with the global results
Key findings from chat metrics
Key findings from satisfaction metrics
Key findings from queue metrics
Key findings from chatbot metrics
Key findings from ticketing metrics
3. Industry-specific breakdowns
Key metrics for the retail industry
Key metrics for software & services
Key metrics for financial services
First response time in retail — company size impacts speed
Productivity vs. satisfaction in financial services
5. Conclusions and key benchmarks for customer service teams
1. Introduction and methodology
By examining over 87 billion website visits, 2 billion chats, and 12 million tickets, we reveal key performance metrics and KPIs that define customer service landscape — from first response time and chat duration to customer satisfaction (CSAT) and chatbot efficiency.
We explore these metrics globally and across core industries like retail, software & services, financial services, and real estate, helping you benchmark against peers and identify actionable trends.
This report goes beyond raw numbers to interpret what these metrics mean for agent productivity, shift planning, and the broader customer experience (CX). You’ll also find segment-specific insights, including the most relevant KPIs for customer service managers, ecommerce teams, and businesses scaling AI in customer support.
This report also offers a snapshot on how companies used live chat, automation, and self-service in the recent year. The data provided on this page was last updated in 2024.
2. Metrics covered in the report along with the global results
Here’s a breakdown of the key customer service KPIs we looked at in this report — grouped by category for easy navigation. Each metric includes a clear explanation, how it’s measured, and the global average, giving you a benchmark for comparison across thousands of businesses.
Chat metrics
| Metric | Global Average | Description |
| Number of chats | 1,676,529,825 | Total number of chats handled from all businesses. |
| Chats per agent | 84.1 | Average number of chats handled by a single agent per day. |
| Chat availability | 17 hours 58 minutes | Average number of hours per day that businesses were available via live chat. |
| First response time | 35 seconds | Average time taken by an agent to send the first response to a customer. |
| Chatting time per agent | 11 hours 48 minutes | Average daily time agents spend actively chatting with customers. |
| Chat duration | 8 minutes 25 seconds | Average duration of a single chat conversation. |
| Total chats duration per business | 29 hours 29 minutes | Average total daily chat time per business across all agents. |
| Mobile vs. desktop | 94.2% avg. | Monthly number of chats per device |
|
Percent of chats rated |
6.7% |
Share of total chats that received a customer rating |
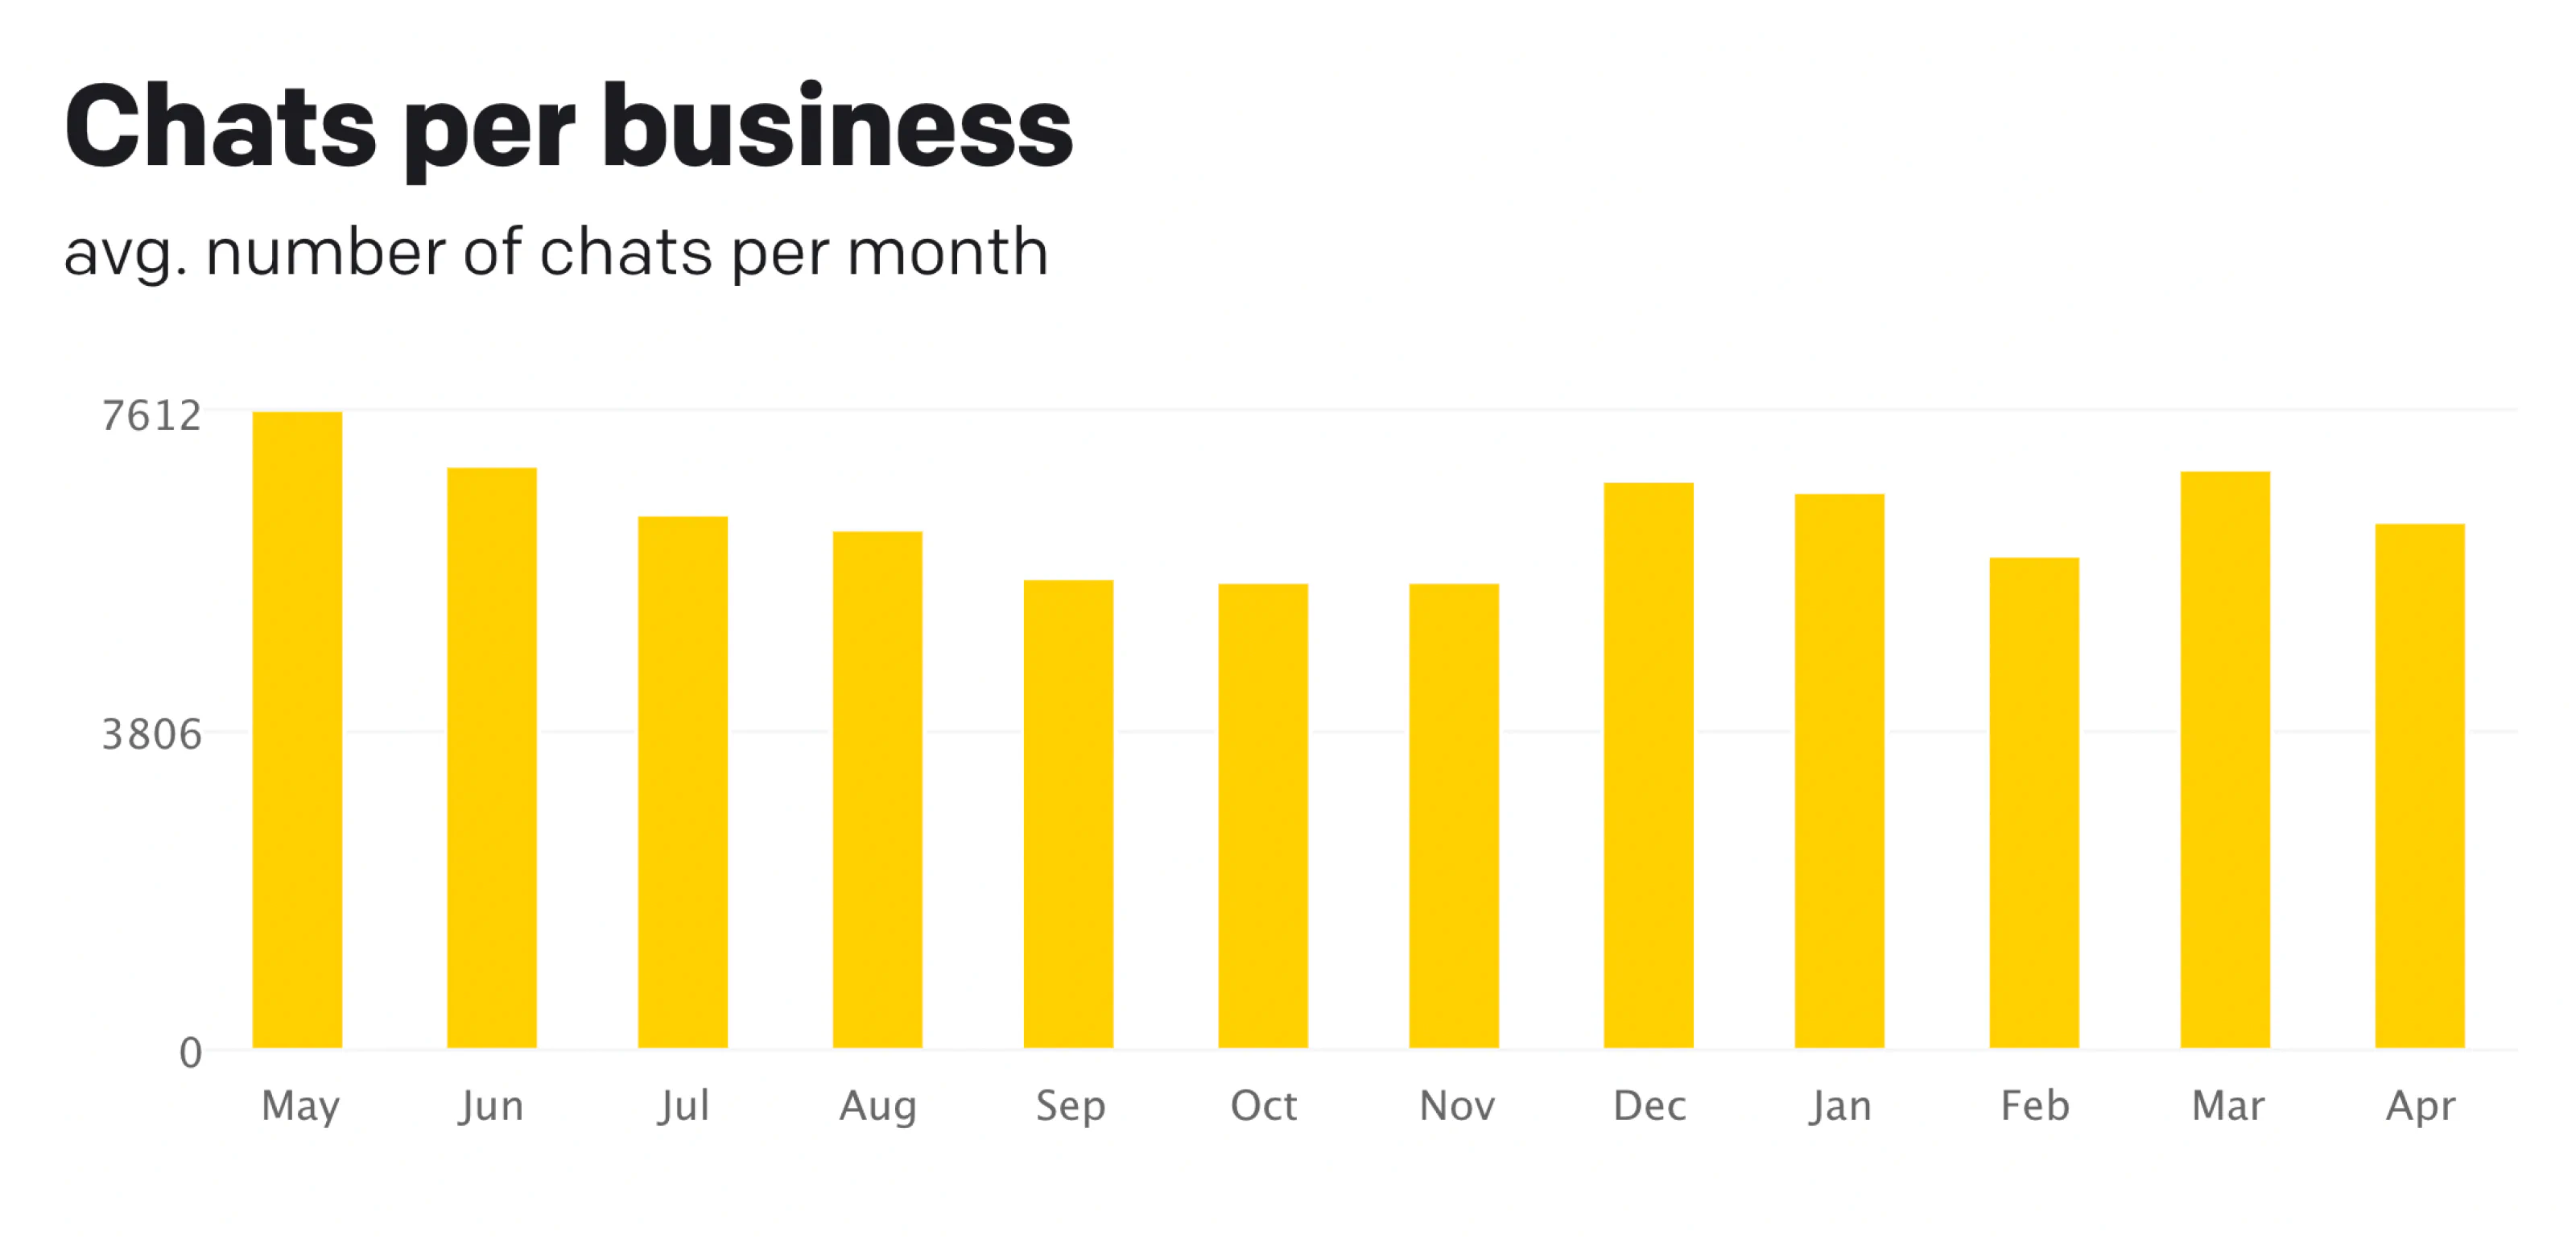
Average number of chats handled per business per month.
Key findings from chat metrics
Businesses using LiveChat® handled over 1.67 billion chats, illustrating the scale at which live chat supports modern customer service operations.
On average, each business handled around 6,794 chats per month, though this number varies depending on industry, region, and customer base.
Support agents stayed busy, managing 84.1 chats per day while spending about 11 hours and 48 minutes actively chatting. This underscores the intensity and multitasking demands of real-time support.
Businesses made themselves available to customers for an average of 17 hours and 58 minutes per day, extending well beyond traditional business hours.
When customers started a conversation, they typically received their first response in 35 seconds — a quick reply that plays a critical role in setting the tone for a positive interaction.
The average chat lasted 8 minutes and 25 seconds, and collectively, businesses spent about 29 hours and 29 minutes per day chatting with customers across all agents.
Most chats (94.2%) occurred on mobile devices, with desktop making up the remaining share. This insight helps inform design decisions and communication strategies.
Finally, 6.7% of chats were rated by customers, offering a valuable feedback loop for measuring service quality.
We are now undoubtedly at peak adoption for using chat throughout the customer lifecycle. Businesses of all sizes and sectors are creating immersive and engaging experiences using chat in order to acquire new customers. Chat allows relationships to be developed while prospective customers are still at the awareness/interest stage, and the level of hyper-personalization achievable drives results earlier than ever before.
Joe Bush, CEO, The Chat Shop
Satisfaction metrics
| Metric | Global Average | Description |
| Customer satisfaction (CSAT) | 64.2% | Average satisfaction score from chats rated by customers. |
| Chatbot satisfaction | 64.7% | Satisfaction rating from chats handled by chatbots. |
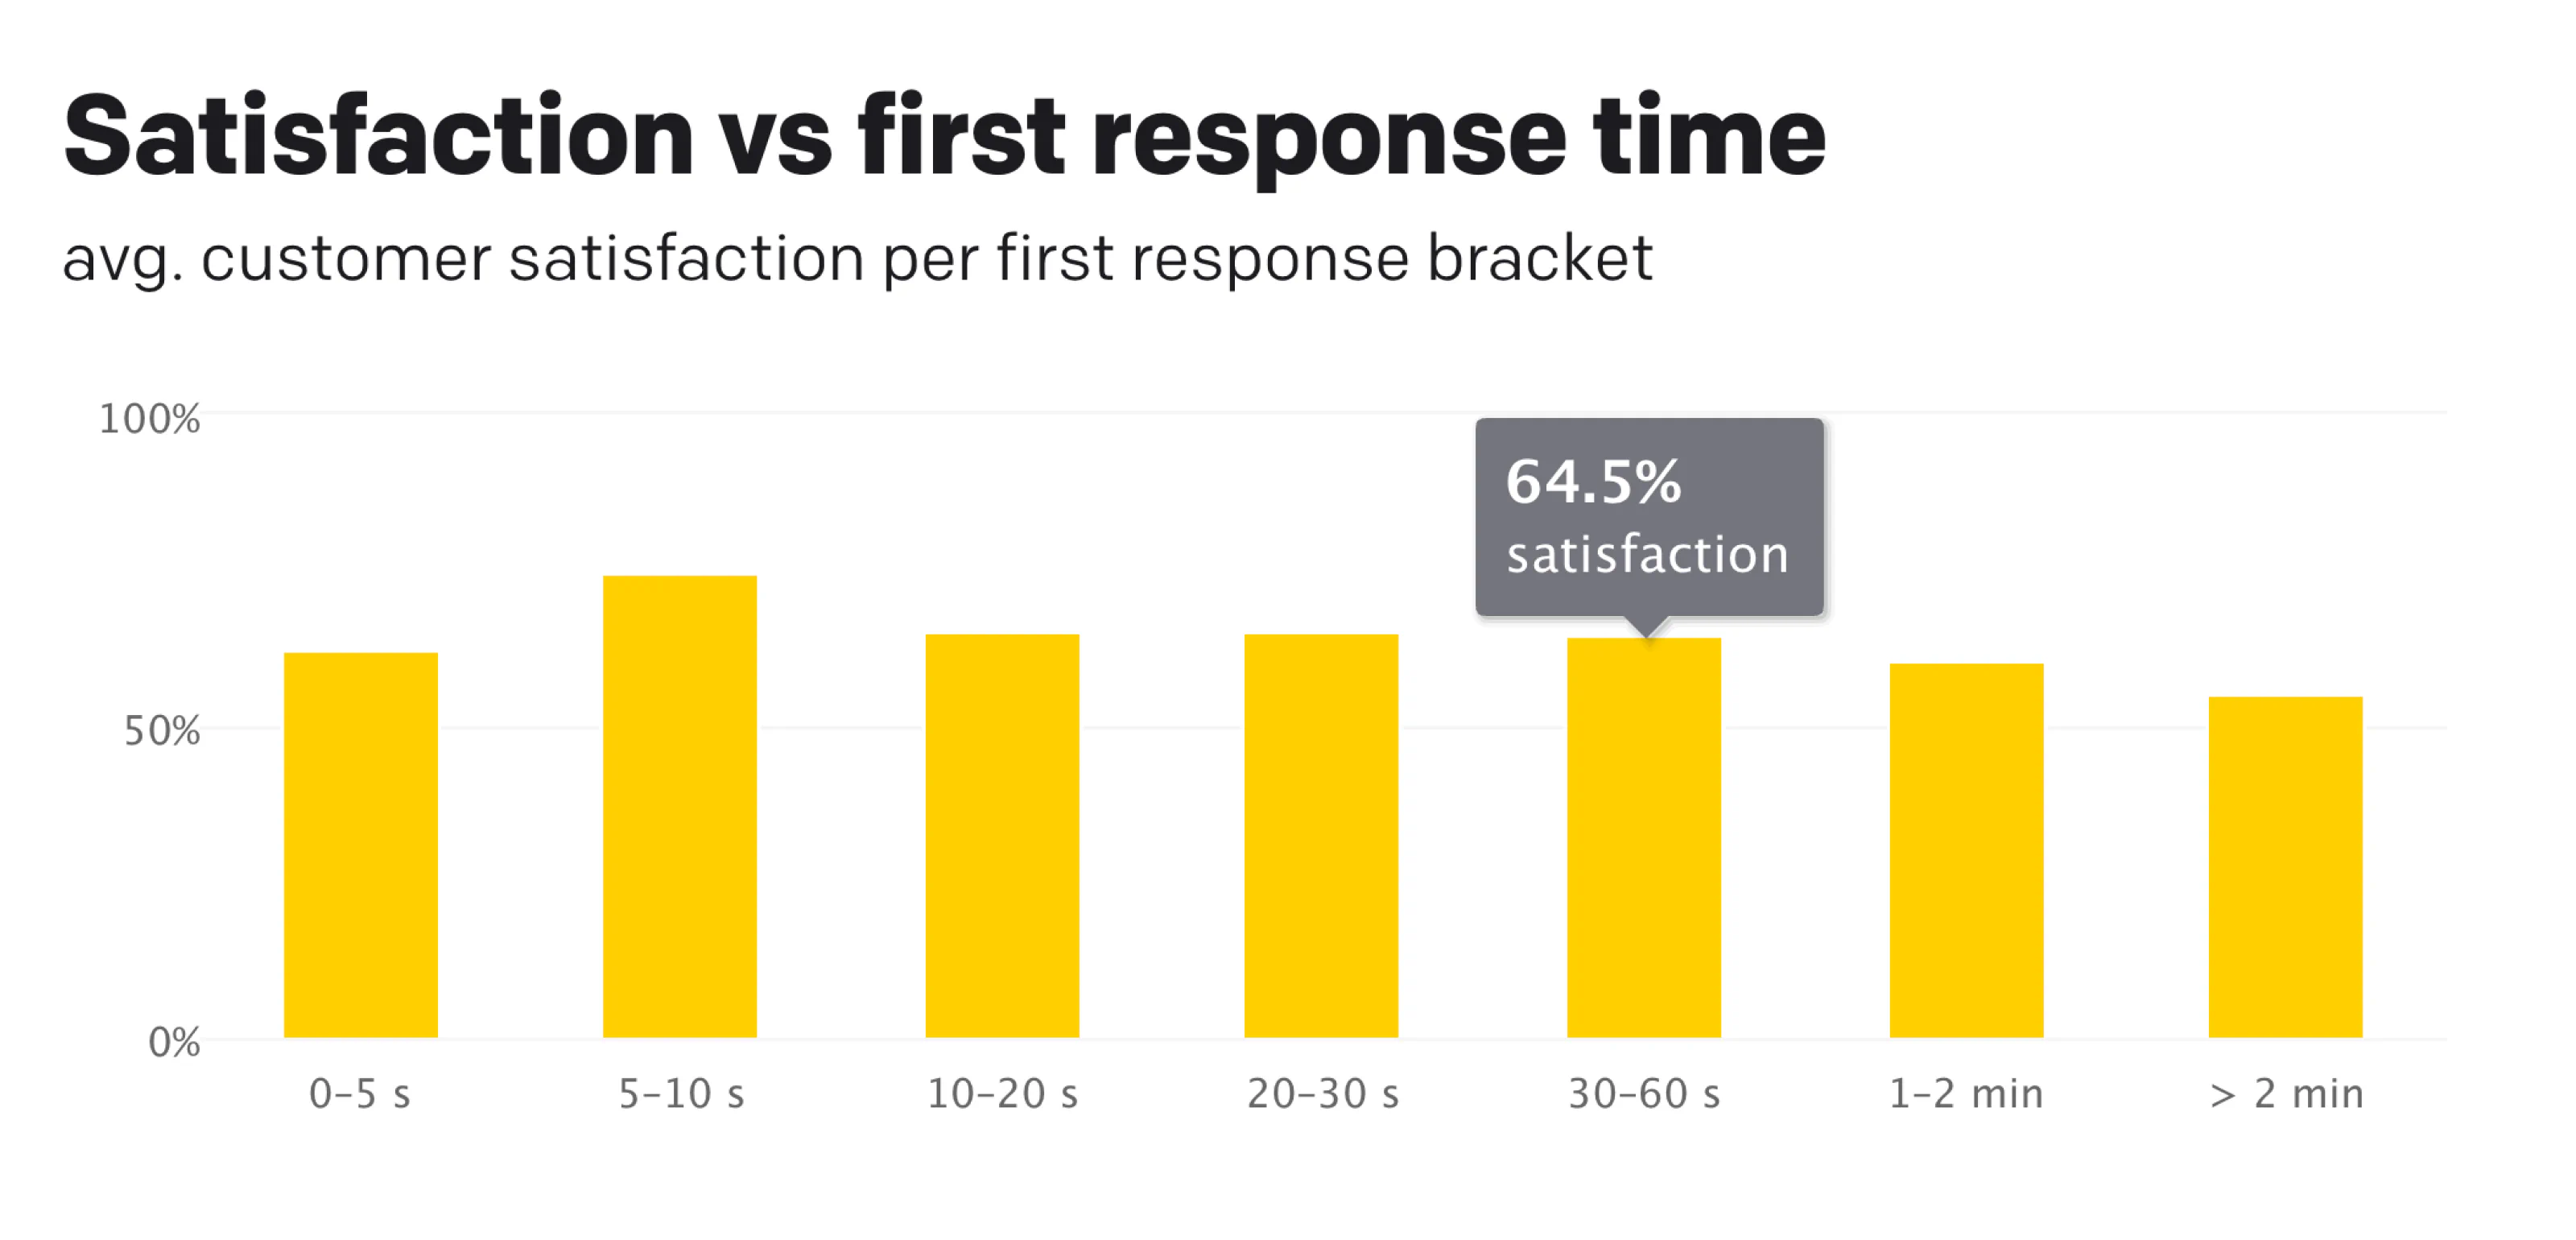
Satisfaction trends based on response time brackets.
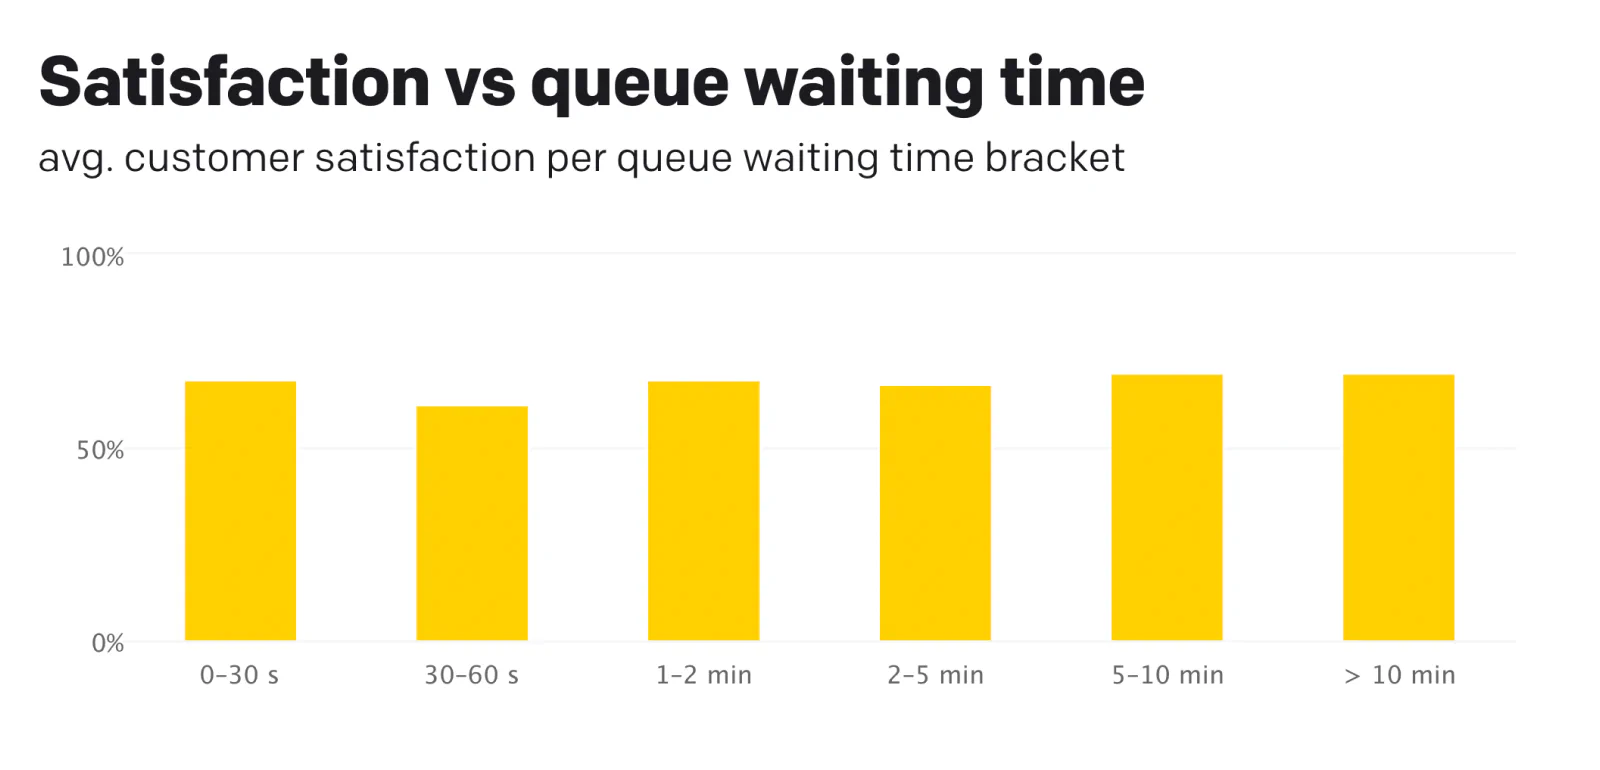
Satisfaction levels depending on how long users waited in a queue.
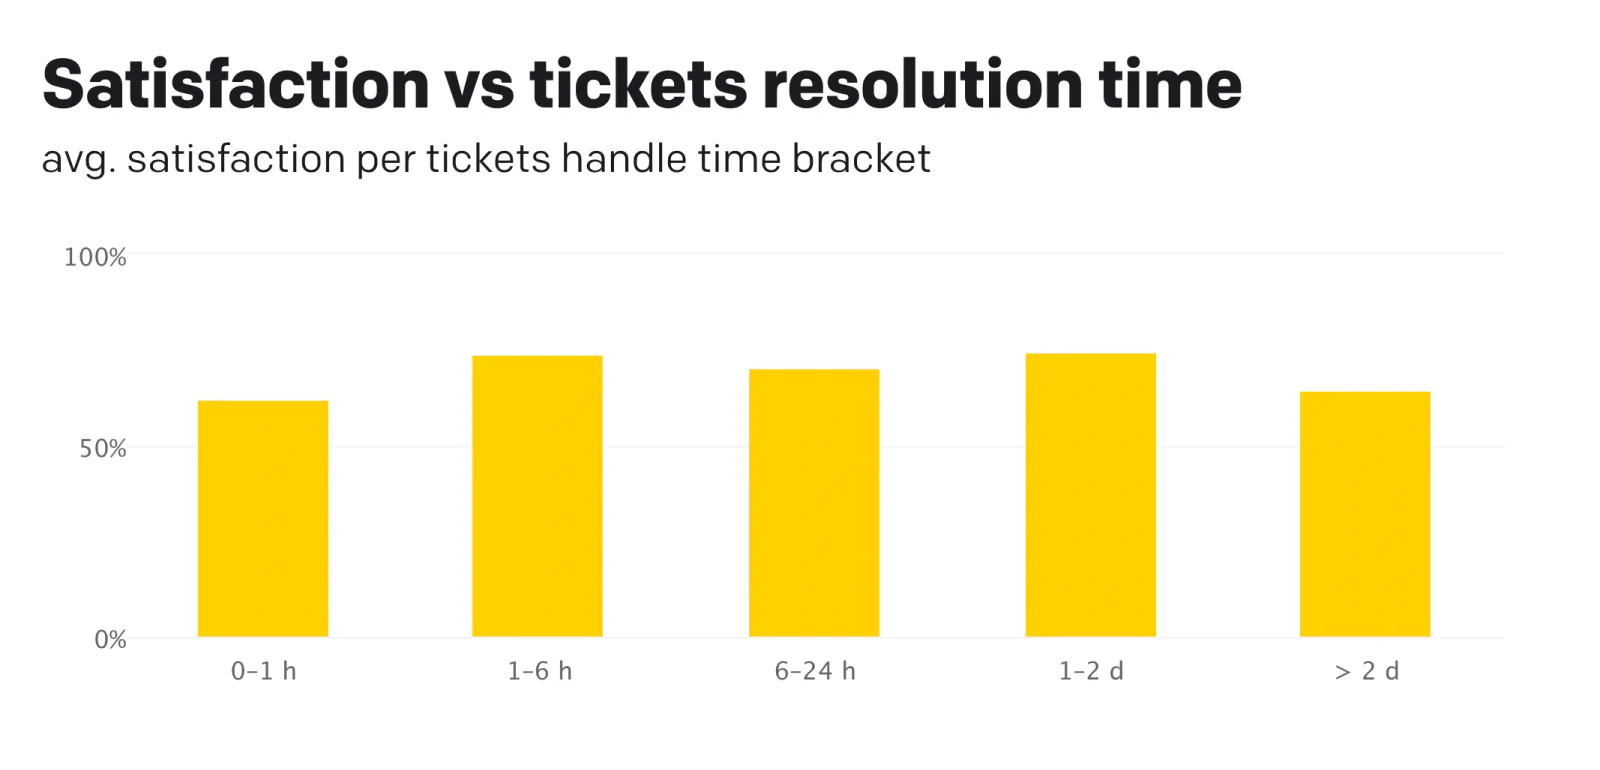
Correlation between satisfaction and time it took to resolve a ticket
Key findings from satisfaction metrics
Across all rated chats, the CSAT score averaged 64.2%, reflecting how customers felt about the support they received — including resolution time, tone, and clarity.
Chatbot-handled conversations yielded a similar score of
64.7%, suggesting that well-implemented automation can perform on par with
human agents in many scenarios.
Live chat is a customer support option that can be more kind to support representatives and customers alike, especially compared to live video solutions. However, in the chat business, more and better integrations between apps are what we hear customers ask for over and over. They are using more tools, but the tools are siloed.
Jon Burke, Business Lead for P2, Automattic
Queue metrics
| Metric | Global Average | Description |
| Queue waiting time | 4 minutes 18 seconds | Average time customers spend in a queue before reaching an agent. |
| Queue dropout rate | 27.4% | Percentage of customers who left the queue before being served. |
Key findings from queue metrics
Customers waited in line an average of 4 minutes and 18 seconds before reaching an agent — a number that can significantly influence satisfaction and dropout rates.
The queue dropout rate was 27.4%, meaning more than one in four customers left before getting a response. Reducing this number can drive retention and improve first-contact resolution.
Chatbot metrics
| Metric | Global Total | Description |
| Chats with chatbot | 163,480,050 | Number of conversations where a chatbot participated. |
| Chats without chatbot | 1,513,049,775 | Number of conversations handled exclusively by human agents. |
Key findings from chatbot metrics
Automation handled a major share of the workload, with over 163 million chats involving a chatbot. Still, more than 1.5 billion chats were managed exclusively by human agents.
The division highlights how bots and agents work together — bots taking the lead on routine tasks while agents step in for more complex or sensitive issues.
Ticketing metrics
Key findings from ticketing metrics
When real-time chat wasn’t enough, customers turned to tickets — generating nearly 12 million cases through asynchronous channels. These are often used for after-hours support or multi-step issues.
Further insights will include how resolution speed impacts satisfaction across different ticket durations.
3. Industry-specific breakdowns
Key metrics for the retail industry
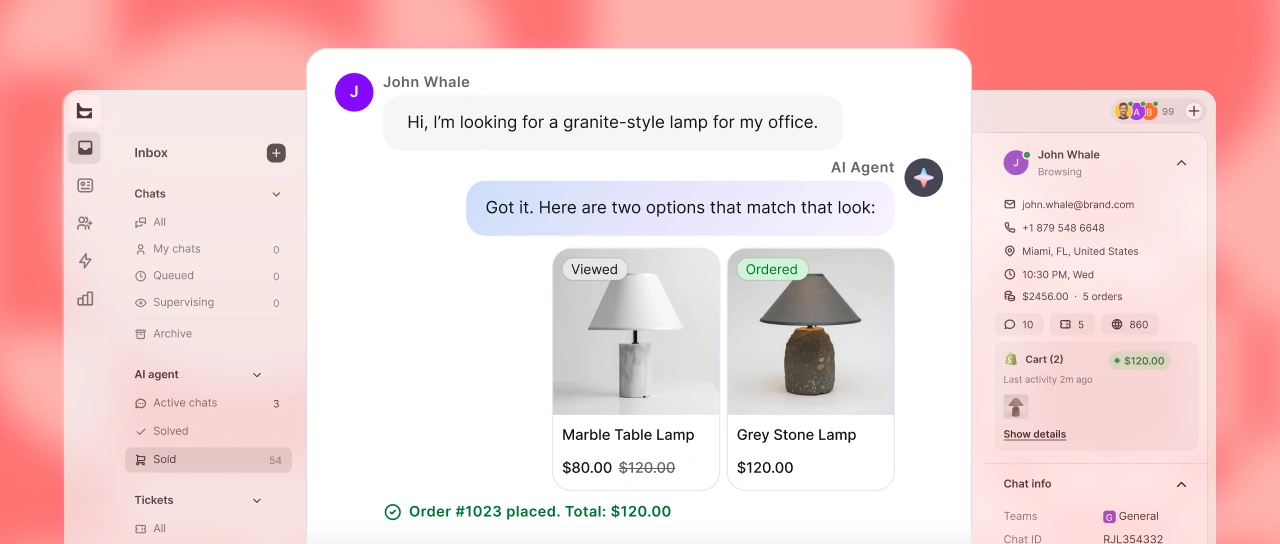
Retail — particularly ecommerce — depends on real-time responsiveness, high-volume efficiency, and support that doesn’t interrupt the buying process. Support speed and clarity can make or break a sale, whether customers are asking about a product, checking stock, or seeking return info.
Here's how key customer service metrics play out in the retail sector and what they reveal:
Chats per agent: 18.4 per day
Retail agents handle significantly fewer chats per day than the global average of 84.1. This suggests that either support teams are smaller or chat traffic is more distributed. It also reflects that retail chats may require focused, transactional help rather than high multitasking capacity.
Why it matters: Keeping this number in check ensures agents aren't overwhelmed during peak hours and can still offer personalized support.
Chatting time per agent: 2 hours and 45 minutes daily
This is notably lower than the global average of 11 hours and 48 minutes, reinforcing the idea that retail support is more aligned with customer traffic patterns — especially evenings and weekends.
Why it matters: Teams must be staffed strategically around shopping peaks, and automation can help cover off-hours.
Total chats duration per business: ~9 hours/day
Retail businesses average around 9 hours of total chat time daily — slightly above the global benchmark of 8 hours and 25 seconds.
Why it matters: This suggests that while retail chats are often quick and transactional, the overall time spent adds up — likely due to high volume. It reinforces the importance of efficiency and automation in retail customer service, especially during peak shopping periods when scale matters most.
First response time: 55 seconds
Retail’s first reply takes about 20 seconds longer than the global average (35 seconds). While still under a minute, this delay might reflect volume spikes during sales events or limited off-hour staffing.
Why it matters: Seconds count in ecommerce. A delay in response can translate to cart abandonment or lost trust.
Remote chat methods will continue to need smart, AI-enabled features that give businesses access to smart, time-saving tools. These capabilities offer a competitive advantage, so brands can quickly and efficiently connect with customers. This industry will also need to ensure that conversational commerce software is integrated into other business tools so merchants have a complete, one-stop shop for their operations. This will offer a 360-degree view of their business, ensuring that everything is working side-by-side and not in silos.
Naomi Wheeless, Global Head of Customer Success, Square
Ticket volume: 759,875 total
Retail’s ticket usage is modest — much lower than the global ticket count of nearly 12 million. This implies most issues are resolved in real time rather than escalated or postponed.
Why it matters: Low ticket volume signals strong first-contact resolution, but may also indicate limited after-hours or long-form support.
Chats with chatbot: 4.8 million
Bots were present in just under 5 million chats — a fraction of the 163 million chatbot-assisted chats globally. This suggests retail is underutilizing automation compared to other sectors.
Why it matters: With seasonal spikes and 24/7 customer expectations, there’s a huge potential to use bots for FAQs, order status, and pre-sale questions.
Chatbot satisfaction: 74.4%
This is above the global average of 64.7%, showing that retail bots are doing a good job when deployed. Customers are happy with the speed and simplicity of answers bots provide for transactional queries.
Why it matters: With the right implementation, bots in retail can deliver both speed and satisfaction — freeing agents for more complex cases.
Summary
Retail support is fast, focused, and time-sensitive. Compared to global averages, retail teams:
- Handle fewer chats per agent, but still need to be sharp and responsive.
- Spend less total time chatting, meaning each interaction must count.
- Are positioned to benefit significantly from automation, especially during high-traffic periods.
For ecommerce and retail leaders, the message is clear: speed, efficiency, and smart scaling
(with automation) are the levers that improve CX and revenue outcomes.
Personalized customer service is an essential ingredient for brands to compete in today's marketplace. 72% of customers are more likely to purchase from a website if they can communicate with the brand in real time. Bringing customer data from your owned channels into one place to segment customers by their behaviors and relevant attributes has enabled brands to excel.
Dan Caldwell, Strategic Partner Manager, Klaviyo
Key metrics for software & services
SaaS companies operate in a landscape where precision, speed, and clarity are non-negotiable. Whether it’s helping users get started, troubleshoot, or manage their accounts, customer support must balance volume with depth — often in real time.
Here’s how software & services support teams perform across the most relevant KPIs and what that means in context:
Chats per agent: 58.7/day
SaaS agents manage a high daily volume, second only to global averages. This reflects both scalability and the need for lean, efficient teams that can handle diverse customer issues.
Why it matters: Efficient handling of multiple chats ensures responsiveness without compromising quality — especially vital when technical clarity is key.
Chatting time per agent: 9 hours and 11 minutes daily
This metric is well above the retail average and just slightly below the global figure of 11 hours and 48 minutes. It signals longer, more involved interactions, which is typical in SaaS where agents often walk users through complex setups or problem-solving steps.
Why it matters: High chat time reflects the depth of support. It’s also a signal to monitor agent workload and prevent burnout.
First response time: 35 seconds
Perfectly aligned with the global average, this indicates SaaS teams are meeting expectations when it comes to initial responsiveness.
Why it matters: A quick first touch reassures users and sets the tone for a helpful, professional interaction — especially during onboarding or bug reports.
Ticket volume: 1.2M (1,228,018)
A high ticket volume compared to other industries shows that SaaS companies often deal with issues that can't be resolved in one chat — requiring follow-up, collaboration, or technical escalation.
Why it matters: Support teams must be well integrated with product and engineering, with systems that manage multi-touch cases smoothly.
Chatbot satisfaction: 59.2%
This is notably lower than the global average of 64.7% and much lower than retail’s 74.4%. It suggests that users may expect more depth and personalization than bots currently deliver in SaaS contexts.
Why it matters: Bots work best when trained on real product data and can deliver actionable next steps, not just surface-level help. There's an opportunity here for more domain-specific AI.
Total chats duration (avg. per chat): 9 minutes and 24 seconds
This is slightly longer than the global average of 8 minutes and 25 seconds, which tracks with the complexity of SaaS queries.
Why it matters: These longer chats are justified when they result in clear outcomes and successful onboarding. However, they also hint at the need for good agent tools and knowledge bases to keep things efficient.
We are seeing in both B2B and B2C arenas support teams being leveraged as sales and service. If you have good experience with an SMS-based support ticket, when the rep offers you 25% off your next purchase out of the blue, that conversion rate is going to go through the roof. It will decrease your attrition rate on your support staff as they now can be seen as a crucial part to company growth.
Gabe Macaluso, Director of Client Success, Omnisend
Summary
Software & services teams are busy, efficient, and deeply involved in solving customer problems. The data shows that while chat volume is high, so is the depth and complexity of each interaction. SaaS leaders should focus on:
- Equipping agents with the tools to handle multi-step queries quickly.
- Improving chatbot training to better match user expectations.
- Monitoring workload to ensure that speed doesn’t come at the cost of quality.
Key metrics for financial services
Financial service providers — from fintech startups to established banks and insurance firms — operate in one of the most trust-sensitive environments. Customers expect secure, swift, and reliable communication, and even the smallest delay can affect credibility. Live chat is the preferred channel for real-time resolution and high-volume transactional support.
Here’s how financial support teams perform across key KPIs and what those numbers mean in practice:
Customer satisfaction (CSAT): 66.2%
Slightly above the global average of 64.2%, this CSAT score reflects relatively strong performance in a high-stakes category.
Why it matters: In finance, customer satisfaction is closely tied to trust. A good score shows that support teams are delivering consistent, clear, and secure experiences. All of this is critical when money or sensitive data is involved.
Queue waiting time: 4 minutes and 8 seconds
Just under the global average, but still higher than ideal for urgent support needs.
Why it matters: Financial customers are often dealing with time-sensitive issues — failed transactions, account lockouts, or claims. Every additional second of waiting can heighten frustration and raise risk perception.
First response time: 35 seconds
This response time is fully aligned with the global benchmark, demonstrating a strong commitment to immediate acknowledgment.
Why it matters: A fast first reply is more than a nicety in finance — it signals that the company is reliable, responsive, and in control. It’s often the difference between retained trust and churn.
Chatbot satisfaction: 59.2%
Below the global average (64.7%), this suggests bots may be falling short of expectations when handling more sensitive or complex requests.
Why it matters: While bots are widely used for transactional tasks like KYC, balance checks, or claims status, performance must be exceptionally polished. In a regulated industry, conversational AI must feel helpful and compliant.
Chats per agent: 58.7/day
This matches SaaS figures and is above the retail average, indicating a high daily workload per support rep.
Why it matters: High agent volume in finance reflects 24/7 demand, regulatory complexity, and often-limited resolution via self-service. Efficient agent workflows and coverage planning are key to maintaining service levels.
Chats with chatbot: 20.7M
Bots handled over 20 million conversations in this category — a strong signal of widespread automation adoption.
Why it matters: Many financial institutions now rely on chatbots to handle routine queries and deflect volume from human agents. The opportunity now is to enhance these bots with better contextual understanding and secure handoff to live agents when needed.
Summary
Financial services teams are under pressure to perform — every chat has higher stakes. The data shows strong fundamentals: fast response times, high chat volumes per agent, and growing automation adoption. However, satisfaction with bots lags behind, and queue times could still be optimized.
Leaders in this space should focus on:
- Tightening queue management for time-sensitive queries.
- Boosting bot performance with more financial domain training.
- Equipping agents to handle high volume without sacrificing trust or clarity.
- Monitoring CSAT trends closely to protect customer confidence.
Key metrics for real estate
In real estate, timing is everything. Whether someone’s booking a tour, inquiring about financing, or browsing listings late at night, every chat has the potential to turn into a sale — or a missed opportunity. That's why fast, available, and attentive customer service is critical across digital touchpoints.
Here’s how real estate support teams perform across key KPIs and what the data says about their strengths and areas of opportunity:
First response time: 52 seconds
Slightly slower than the global average, but still within a respectable range for live chat responsiveness.
Why it matters: Real estate leads are highly perishable — prospects often reach out while actively browsing. Even a short delay could mean they move on. Speedy replies increase the odds of capturing interest and driving engagement.
Chat availability: 11 hours and 3 minutes daily
Below the global average of 17 hours and 58 minutes, which may reflect tighter business hours or limited team capacity.
Why it matters: Real estate queries often happen after traditional hours — especially from prospective buyers viewing listings in the evening or on weekends. Extending availability via staggered shifts or automation can significantly increase lead coverage.
Chatbot usage: 57.5K chats
Chatbots supported just over 57,000 conversations in the real estate segment.
Why it matters: Bots can qualify leads, capture key details, book viewings, or answer FAQs around listings — all without needing a live agent. With the right setup, they act as your 24/7 showing assistant.
Queue dropout rate: 16.4%
Lower than the global average (27.4%), suggesting strong queue management and proactive support availability.
Why it matters: A low dropout rate means more people are sticking around to get help — a positive indicator of both availability and relevance of support. It also translates directly to fewer missed opportunities to close a lead.
Customer satisfaction (CSAT): 74%
Well above the global average of 64.2%, making real estate one of the highest-performing industries in terms of perceived support quality.
Why it matters: Trust plays a huge role in real estate. A high CSAT score suggests customers feel heard and guided — essential in decisions involving finances, homes, or investments.
Chat duration: 8 minutes and 34 seconds
Slightly above the global average of 8 minutes and 25 seconds.
Why it matters: Longer chats can indicate more engaged prospects, complex inquiries, or multi-step conversations (discussing listings, pricing, scheduling, etc.). This is a good signal, especially if it correlates with lead conversion.
Summary
Real estate support teams are doing well where it matters most: building trust, offering help without delay and reducing friction in the decision-making process. With high CSAT and low dropout rates, the fundamentals are strong. But there’s room to grow in availability and automation adoption.
To stay competitive in this fast-moving market, teams should:
- Extend chat availability to cover evening and weekend browsing.
- Use chatbots to capture and qualify leads after hours.
- Maintain fast, human-like responsiveness to convert interest into action.
- Leverage satisfaction insights to refine team communication and tone.
4. Interesting findings
First response time in retail — company size impacts speed
In real estate, speed is everything — a quick reply can be the difference between securing a lead or losing it. The data shows that company size plays a significant role in how fast businesses respond:
- Small businesses (1–9 employees) respond in just 31 seconds on average — well below the global benchmark of 35 seconds.
- Mid-sized businesses (50–99 employees) take an average of 1 minute and 22 seconds — more than double the time.
Why it matters: Smaller teams tend to be more nimble, often with agents handling both customer conversations and lead follow-ups directly. As teams grow, more structured workflows and routing can introduce delays. For real estate, where customers expect answers now, scaling without losing speed is critical.
Productivity vs. satisfaction in financial services
Company size strongly affects both agent workload and customer satisfaction in the financial sector:
- Small teams (1–9 employees) • Chats per agent: 37.2/day• Customer satisfaction: 75.7%
- Mid-sized teams (50–99 employees) • Chats per agent: 19.9/day• Customer satisfaction: 83.2%
Smaller teams handle nearly
twice as many chats per agent but report
lower satisfaction scores. The inverse is true for mid-sized companies — fewer
chats per agent but significantly higher CSAT.
What it means:
Higher agent workload in small financial
firms may lead to rushed conversations, longer wait times, or less personalized support — all of
which impact satisfaction. On the other hand, mid-sized teams with more distributed workloads
can offer higher quality service, leading to better customer outcomes. In
financial services, reducing individual agent load can pay off in customer
trust and satisfaction, which is vital in industries where credibility is everything.
5. Conclusions and key benchmarks for customer service teams
Customer service today isn’t just about speed or satisfaction scores. It’s about building systems that scale human connection, efficiency, and insight across every conversation.
The data in this report paints a clear picture: top-performing teams don’t just track performance — they actively design for it. They use metrics not as vanity numbers but as levers to improve operations, plan staffing, guide automation, and sharpen the customer experience.
We’ve seen that top-performing companies optimize for:
- Agent efficiency through smart staffing and clear benchmarks.
- AI-enhanced support that blends human and automated service.
- Self-service strategies that reduce load and empower users.
- Industry-specific insights to tailor support where it matters most.
No matter your starting point, this report gives you more than customer service benchmarks — it gives you context. Use it to find your gaps, fine-tune your support strategy, and invest where it will impact your customers and your team.